Thursday, March 31, 2011

Making the Main Sequence


Working independently, two astronomers, Ejnar Hertsprung (1873–1967) of Denmark and Henry Norris Russell (1877–1957) of the United States studied the relationship between the luminosity of stars and their surface temperatures. Their work (Hertsprung began about 1911) was built on the classification scheme of another woman from the Harvard College Observatory, Antonia Maury. She first classified stars both by the lines observed and the width or shape of the lines. Her scheme was an important step toward realizing that stars of the same temperature could have different luminosity. Plotting the relationship between temperature and luminosity graphically (in what is now known as a Hertzsprung-Russell diagram or H-R diagram), these two men discovered that most stars fall into a well-defined region of the graph. That is, the hotter stars tend to be the most luminous, while the cooler stars are the least luminous.
The region of the temperature luminosity plot where most stars reside is called the main sequence. Most stars are there, because as we will discover, that is where they spend the majority of their lives. Stars that are not on the main sequence are called giants or dwarfs, and we will see how stars leave the main sequence and end up in the far corners of the temperature-luminosity plot.

Sorting the Stars by Size


The radius of a star can be determined from the luminosity of the star (which can be determined if the distance is known) and its surface temperature (from its spectral type). It turns out that stars fall into several distinct classes. In sorting the stars by size, astronomers use a vocabulary that sounds as if it came from a fairytale:
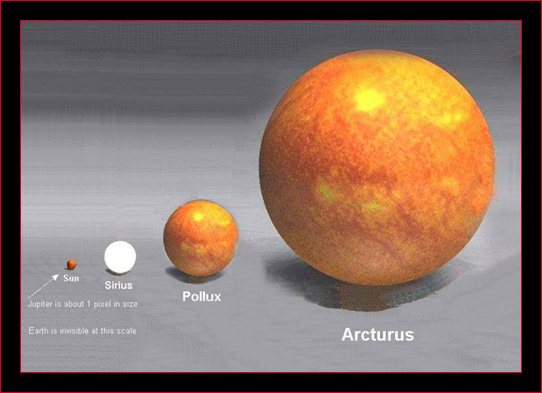
  • A giant is a star whose radius is between 10 and 100 times that of the sun.
  • A supergiant is a star whose radius is more than 100 times that of the sun. Stars of up to 1,000 solar radii are known.
  • A dwarf star has a radius similar to or smaller than the sun.

How Hot Is Hot?


Stars are too distant to stick a thermometer under their tongue. We can’t even do that with our own star, the sun. But you can get a pretty good feel for a star’s temperature simply by looking at its color.
The temperature of a distant object is generally measured by evaluating its apparent brightness at several frequencies in terms of a blackbody curve. The wavelength of the peak intensity of the radiation emitted by the object can be used to measure the object’s temperature. For example, a hot star (with a surface temperature of about 20,000 K) will peak near the ultraviolet end of the spectrum and will produce a blue visible light. At about 7,000 K, a star will look yellowish-white. A star with a surface temperature of about 6,000 K—such as our sun—appears yellow. At temperatures as low as 4,000 K, orange predominates, and at 3,000 K, red.
So simply looking at a star’s color can tell you about its relative temperature. A star that looks blue or white has a much higher surface temperature than a star that looks red or yellow.

Monday, February 28, 2011

Creating a Star Scale of Magnitude


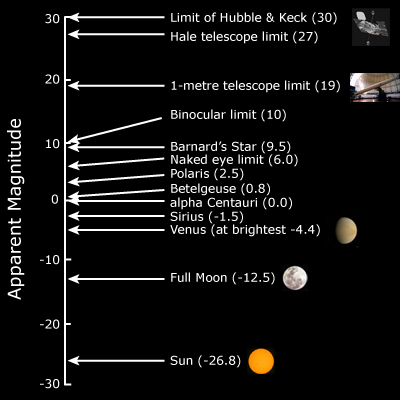
So astronomers have learned to be very careful when classifying stars according to apparent brightness. Classifying stars according to their magnitude seemed a good idea to Hipparchus (in the second century B.C.E.) when he came up with a 6-degree scale, ranging from 1, the brightest stars, to 6, those just barely visible. Unfortunately, this somewhat cumbersome and awkward system (higher magnitudes are fainter, and the brightest objects have negative magnitudes) has persisted to this day.
Hipparchus’ scale has been expanded and refined over the years. The intervals between magnitudes have been regularized, so that a difference of 1 in magnitude corresponds to a difference of about 2.5 in brightness. Thus, a magnitude 1 star is 2.5 ×2.5 ×2.5 ×2.5 ×2.5=100 times brighter than a magnitude 6 star. Because we are no longer limited to viewing the sky with our eyes, and larger apertures collect more light, magnitudes greater than (that is, fainter than) 6 appear on the scale. Objects brighter than the brightest stars may also be included, their magnitudes expressed as negative numbers. Thus the full moon has a magnitude of –12.5 and the sun, –26.8. In order to make more useful comparisons between stars at varying distances, astronomers differentiate between apparent magnitude and absolute magnitude, defining the latter, by convention, as an object’s apparent magnitude when it is at a distance of 10 parsecs from the observer. This convention cancels out distance as a factor in brightness and is therefore an intrinsic property of the star.

Luminosity Versus Apparent Brightness


Ask an astronomer this question, and she will respond that the flashlight, a few feet from your eyes, is apparently brighter than the distant headlights, but that the headlights are more luminous. Luminosity is the total energy radiated by a star each second. Luminosity is a quality intrinsic to the star; brightness may or may not be intrinsic. Absolute brightness is another name for luminosity, but apparent brightness is the fraction of energy emitted by a star that eventually strikes some surface or detection device (including our eyes). Apparent brightness varies with distance. The farther away an object is, the lower its apparent brightness.
Simply put, a very luminous star that is very far away from the earth can appear much fainter than a less luminous star that is much closer to the earth. Thus, although the Sun is the brightest star in the sky, it is not by any means the most luminous.

Do Stars Move?

The ancients believed that the stars were embedded in a distant spherical bowl and moved in unison, never changing their relative positions. We know now, of course, that the daily motion of the stars is due to the earth’s rotation. Yet the stars move, too; however, their great distance from us makes that movement difficult to perceive, except over long periods of time. A jet high in the sky, for example, can appear to be moving rather slowly, yet we know that it has to be moving fast just to stay aloft and its apparent slowness is a result of its distance. Astronomers think of stellar movement in three dimensions:
  • The transverse component of motion is perpendicular to our line of sight—that is, movement
  • across the sky. This motion can be measured directly.
  • The radial component is stellar movement toward or away from us. This motion must be measured from a star’s spectrum.
  • The actual motion of a star is calculated by combining the transverse and radial components.
The transverse component can be measured by carefully comparing photographs of a given piece of the sky taken at different times and measuring the angle of displacement of one star relative to background stars (in arcseconds).
This stellar movement is called proper motion. A star’s distance can be used to translate the angular proper motion thus measured into a transverse velocity in km/s. In our analogy: If you knew how far away that airplane in the sky was, you could turn its apparently slow movement into a true velocity.
Determining the radial component of a star’s motion involves an entirely different process. By studying the spectrum of the target star (which shows the light emitted and absorbed by a star at particular frequencies), astronomers can calculate the star’s approaching or receding velocity. Certain elements and molecules show up in a star’s spectrum as absorption lines (see Chapter 7). The frequencies of particular absorption lines are known if the source is at rest, but if the star is moving toward or away from us, the lines will get shifted. A fast-moving star will have its lines shifted more than a slow-moving one. This phenomenon, more familiar with sound waves, is known as the Doppler effect.
How fast do stars move? And what is the fixed background against which the movement can be measured? For a car, it’s easy enough to say that it’s moving at 45 miles per hour relative to the road. But there are no freeways in space. Stellar speeds can be given relative to the earth, relative to the sun, or relative to the center of the Milky Way. Astronomers always have to specify which reference frame they are using when they give a velocity. Stars in our neighborhood typically move at tens of kilometers per second relative to the sun.

Monday, January 31, 2011

Nearest and Farthest


Other than the sun, the star closest to us is Alpha Centauri, which has the largest known stellar parallax of 0.76 arc seconds. In general, the distance to a star in parsecs (abbreviated pc) is equal to 1 divided by the stellar parallax in arcseconds—or conversely, its parallax will be equal to 1 divided by the distance in parsecs. The measured parallax, in any case, will be a very small angle (less than an arcsecond). Recall that the moon takes up about 1,800” on the sky when full, so the parallax measured for Alpha Centauri is about 1⁄2000 the diameter of the full moon! Using the rule above to convert parallax into distance, we find that Alpha Centauri is about 1.3 pc or 4.2 light-years away. On average, stars in our Galaxy are separated by 7 light-years. So Alpha Centauri is even closer than “normal.” If a star were 10 pc away, it would have a parallax of 1⁄10 or 0.1”.
The farthest stellar distances that can be measured using parallax are about 100 parsecs (333 light-years). Stars at this distance have a parallax of 1⁄100” or 0.01”. That apparent motion is the smallest that we can measure with our best telescopes. Within our own Galaxy, most stars are even farther away than this. As telescope resolutions improve with the addition of adaptive optics, this outer limit will be pushed farther out.