Thursday, March 31, 2011
Making the Main Sequence
Working independently, two astronomers, Ejnar Hertsprung (1873–1967) of Denmark and Henry Norris Russell (1877–1957) of the United States studied the relationship between the luminosity of stars and their surface temperatures. Their work (Hertsprung began about 1911) was built on the classification scheme of another woman from the Harvard College Observatory, Antonia Maury. She first classified stars both by the lines observed and the width or shape of the lines. Her scheme was an important step toward realizing that stars of the same temperature could have different luminosity. Plotting the relationship between temperature and luminosity graphically (in what is now known as a Hertzsprung-Russell diagram or H-R diagram), these two men discovered that most stars fall into a well-defined region of the graph. That is, the hotter stars tend to be the most luminous, while the cooler stars are the least luminous.
The region of the temperature luminosity plot where most stars reside is called the main sequence. Most stars are there, because as we will discover, that is where they spend the majority of their lives. Stars that are not on the main sequence are called giants or dwarfs, and we will see how stars leave the main sequence and end up in the far corners of the temperature-luminosity plot.
Sorting the Stars by Size
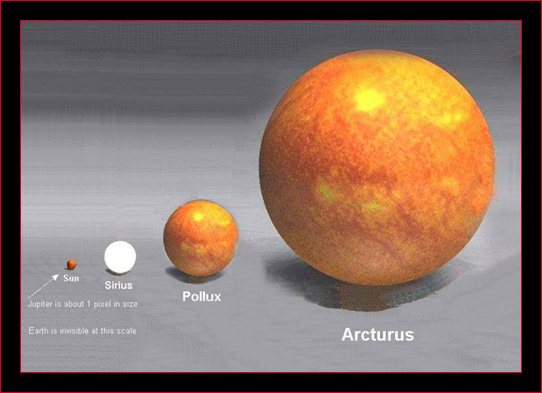
The radius of a star can be determined from the luminosity of the star (which can be determined if the distance is known) and its surface temperature (from its spectral type). It turns out that stars fall into several distinct classes. In sorting the stars by size, astronomers use a vocabulary that sounds as if it came from a fairytale:
- A giant is a star whose radius is between 10 and 100 times that of the sun.
- A supergiant is a star whose radius is more than 100 times that of the sun. Stars of up to 1,000 solar radii are known.
- A dwarf star has a radius similar to or smaller than the sun.
How Hot Is Hot?
Stars are too distant to stick a thermometer under their tongue. We can’t even do that with our own star, the sun. But you can get a pretty good feel for a star’s temperature simply by looking at its color.
The temperature of a distant object is generally measured by evaluating its apparent brightness at several frequencies in terms of a blackbody curve. The wavelength of the peak intensity of the radiation emitted by the object can be used to measure the object’s temperature. For example, a hot star (with a surface temperature of about 20,000 K) will peak near the ultraviolet end of the spectrum and will produce a blue visible light. At about 7,000 K, a star will look yellowish-white. A star with a surface temperature of about 6,000 K—such as our sun—appears yellow. At temperatures as low as 4,000 K, orange predominates, and at 3,000 K, red.
So simply looking at a star’s color can tell you about its relative temperature. A star that looks blue or white has a much higher surface temperature than a star that looks red or yellow.
Subscribe to:
Posts (Atom)